Metric Example:
Clicks, sessions, open rates.
Indicate what happened, but not if it was good.
Turn marketing data into insight — track what matters, measure performance, and make better decisions.
Metrics measure activity — they’re data points. KPIs (Key Performance Indicators) are strategic — they measure success against goals.
Every KPI is a metric, but not every metric is a KPI.
Clicks, sessions, open rates.
Indicate what happened, but not if it was good.
Conversion rate, ROI, retention rate.
Show whether goals were achieved.
| Category | Metric | Formula | Why It Matters |
|---|---|---|---|
| Traffic | CTR (Click-Through Rate) | (Clicks ÷ Impressions) × 100 | Shows ad or content engagement. |
| Conversion | CVR (Conversion Rate) | (Conversions ÷ Visits) × 100 | Reveals how effectively traffic becomes leads or customers. |
| Cost | CPA (Cost Per Acquisition) | Spend ÷ Conversions | Measures how much you pay for a conversion. |
| Revenue | ROAS (Return on Ad Spend) | Revenue ÷ Ad Spend | Evaluates campaign profitability. |
| Engagement | Engagement Rate | (Likes + Comments + Shares) ÷ Reach | Measures content resonance and audience activity. |
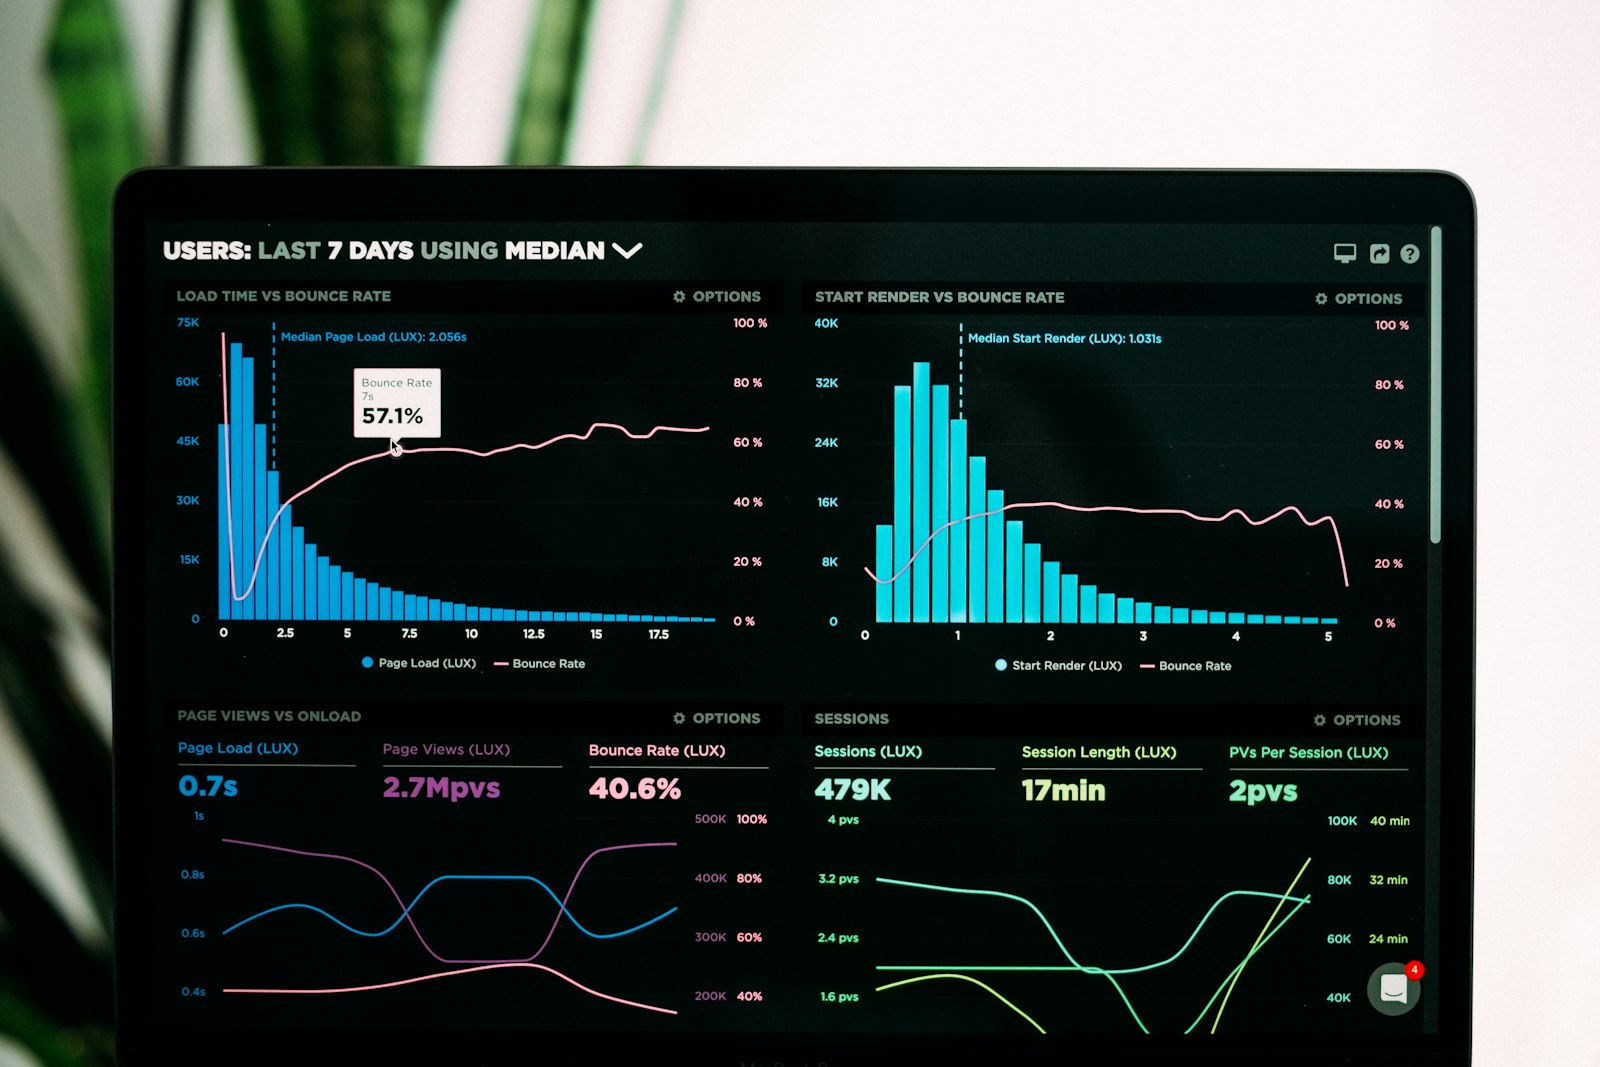
Visual dashboards turn raw numbers into insights. Use color, hierarchy, and context — not clutter. Below is an example of a balanced KPI dashboard layout: